The Circumference of the Earth

I often find it amazing that people long ago, made many discoveries that we would find difficult without today’s equipment and computing power. If asked “how long ago was the size of Earth accurately determined?”, what would you guess? Somewhere between 1500 CE and today? What about between 500 CE and today? It turns out that calculation was made almost 2300 years ago, around 245 BCE.

Eratosthenes

Eratosthenes was a Greek mathematician, astronomer, philosopher, poet, and music theorist. He was born in 276 BCE and died in 194 BCE. He noticed that in Syene (now Aswan Egypt), that a well with vertical sides did not cast any shadow midday at the summer solstice (when the sun is at its highest point in the sky as the earth revolves about the sun). However, in Alexandria, a vertical pole stuck into the ground, cast a shadow at the same time of the day and year. This happens because the earth is spherical and the direction of the sun at different latitudes is different.

So Eratosthenes measured the length of the pole above the ground in Alexandria and the length of the shadow. How can we use these measurements?

The Calculations

First let’s measure the angle the shadow in Alexandria makes with the stick. To get the same answer as Eratosthenes, I will assume the height of the stick above the ground in Alexandria was 1 meter and the length of the shadow was 12.63 centimeters:

From trigonometry, the tangent of the angle ????, is the opposite side divided by the adjacent side. So if we use the inverse tangent on 0.1263m/1m (the angle whose tangent is 0.1263), we get ???? = 7.2°. What does this angle have anything to do with the earth? Quite a lot actually.

Now let’s draw the earth underneath the stick:

As the sun is very far away, we can approximate the rays from the sun as being parallel at any spot on earth, so the line between the center of the earth and the well in Syrene is parallel to the edge of the stick’s shadow in Alexandria. This means that the angle between the stick and the well at the earth’s center is the same, 7.2°.

Now there are 360° to span the entire circumference of the earth, so the curved distance between Alexandria and Syrene divided by the earth’s circumference will be the same as 7.2°/360° = 0.02. But what is that curved distance.

Evidently, there were people called “bematists” who were trained to measure large distances by counting their steps. Well Eratosthenes employed them to measure the distance between Alexandria and Syrene. Looking at the map, the Nile River gets in the way of this at several places, but I’ll assume they found a way to handle this.

Converting their units to meters, they measured the distance to be 800 kilometers. So 800/(earth’s circumference) = 0.02, which means that earth’s circumference = 40,000 km.

This is a very accurate estimate of the earth’s circumference. As the earth is not a perfect sphere, the circumference measured around the poles is 40,008 km using satellite data and all sorts of equipment and calculation power not available to Eratosthenes. The circumference around the equator is 40,075 km.

Using the formula for the circumference of a circle, we can also get an estimate of the earth’s diameter: C = ????d ⟹ d = 40000/???? = 12,732 km compared to the technology derived value of 12,714 km.

I am impressed!

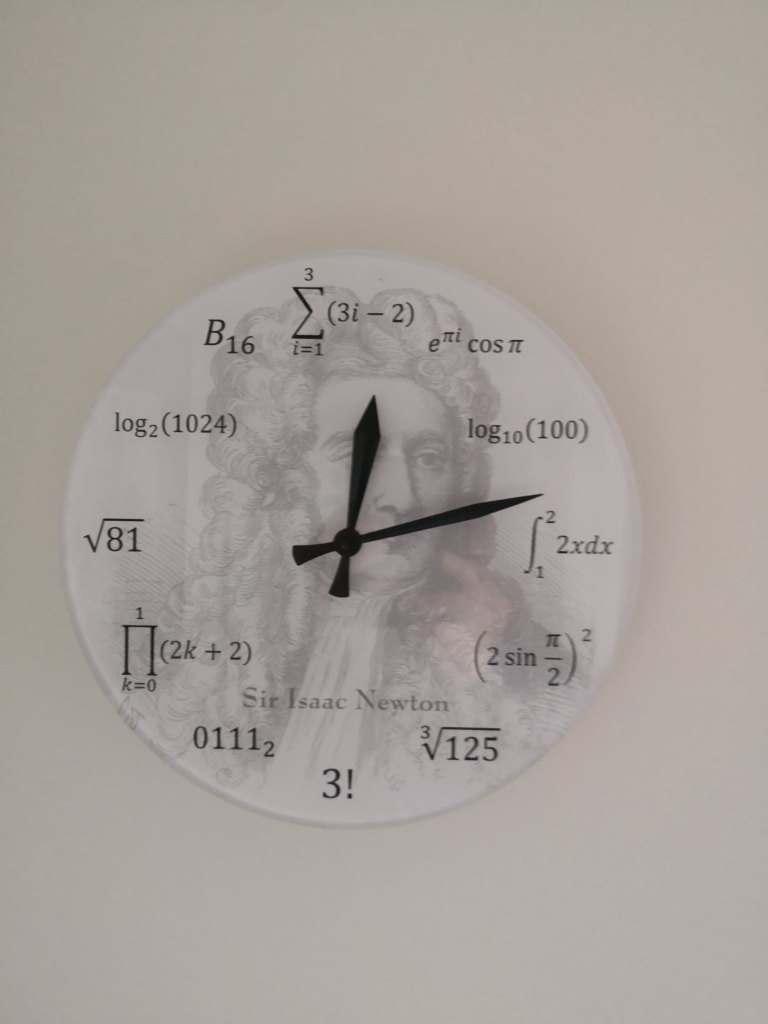
Newton’s Clock, Part 3

So now I’m up to “4” on Newton’s clock:

So the expression

\[
{\left({2\sin\frac{\mathit{\pi}}{2}}\right)}^{2}
\]

uses the sine function which has been talked about many posts before. Only this time, it is using radian measure of angles instead of degrees. If your calculator is in degree mode, you can substitute 90° in place of ????/2 to get the same answer. The sine of ????/2 radians or 90° is 1. So in the brackets we have 2 × 1 = 2. 2² = 4, hence its position on the clock.

Now let’s look at

\[
\sqrt[3]{125}
\]

This is the cube root of 125. This expression is asking the question: “What number multiplied 3 times equals 125?”. The answer to that is 5 because 5 × 5 × 5 = 125. So once again, the clock does not lie.

Now let’s look at 3! This is pronounced “3 factorial”. The factorial of a number is that number successively multiplied by a number which is 1 less. So 5! = 5 × 4 × 3 × 2 × 1 = 120. So 3! = 3 × 2 × 1 = 6. Factorials are used a lot in probability. I have touched on this before but perhaps there is another future post here.

Now let’s look at 01112. We are very familiar with decimal system way of counting. This system is a base 10 system because we use 10 distinct digits (symbols) to count: 0, 1, 2, 3, 4, 5, 6, 7, 8, and 9. When we run out of digits, like when we count up to 9, we add another place holder to the right of the number and put the starting digit 0 there: 10. And then successively increase it’s digits until we get to 9 again. then we increase the left digit by 1 and start over again: 20, 21, … . There are other number systems based on numbers other than ten.

Computers are composed of switches based on two states, on or off. We mathematically say that off is 0 and on is 1. Computers essentially count with just o’s and 1’s: a base 2 system. Counting in base 2 is done exactly as we do in base 10, we just have fewer digits to work with.

So we if we start counting we get 0, 1, but we’ve ran out of digits so we add a place holder to the right and start again: 0, 1, 10, 11. Ran out of digits again so add another place holder and start over: 0, 1, 10, 11, 100, 101, 110, 111. If you are keeping track, 111 in base 2 is equal to 7 in base 10. It is a convention to subscript a number with its base when dealing with other base systems, so 01112 means 7 in base 10. The leading 0 doesn’t add to the value but in computer maths, base 2 numbers are typically written 4 digit places at a time.

Inverse Operations

I said a little about operations that are inverses to each other when I talked about square roots. Operations (or functions on numbers – I may use operations and functions interchangeably) are inverses of each other if those operations, when performed sequentially on a number, result in the original number.

For example, consider the operations of adding, then subtracting 4 to/from a number. Let’s use 5:

5 + 4 = 9, 9 – 4 = 5, the original number. More directly,

5 + 4 – 4 = 5 + 0 = 5

So no surprise, addition and subtraction are inverse operations. It doesn’t matter what the starting number is or the number you are adding or subtracting. In general, if you start with a number x, + y and – y are inverse operations:

x + yy = x

The order of these operations does not matter – I can first subtract 4 then add 4. Multiplication and division are also inverse operations. For example,

5 × 2 = 10, 10 ÷ 2 = 5 or 5 × 2 ÷ 2 = 5 × 1 = 5

Other less familiar inverse operations are squaring a number and taking a number’s square root. For example, I can square 4 then take it square root or take its square root the square the result and I will get 4 back in either direction:

\[
\begin{array}{l}
{\sqrt{{4}^{2}}\hspace{0.33em}{=}\hspace{0.33em}\sqrt{16}\hspace{0.33em}{=}\hspace{0.33em}{4}}\\
{{\left({\sqrt{4}}\right)}^{2}\hspace{0.33em}{=}\hspace{0.33em}{2}^{2}\hspace{0.33em}{=}\hspace{0.33em}{4}}
\end{array}
\]

In general,

\[
\begin{array}{l}
{\sqrt{{x}^{2}}\hspace{0.33em}{=}\hspace{0.33em}{x}}\\
{{\left({\sqrt{x}}\right)}^{2}\hspace{0.33em}{=}\hspace{0.33em}{x}}
\end{array}
\]

There are other ones like this as well: cube and cube roots, raise to the fourth power and fourth roots, etc.

Another less well known one, and one that confuses many of my students, is exponential and logarithm operations.

When x is the base and a number, say 2, is in the exponent, as in x², this is a power operation. However, when x is the exponent, and a number called e is in the base, this is called an exponential operation, .

I won’t spend much time on e, but it is an irrational number like ???? and there are several reasons why it is the ‘base of choice’. So if the operation is to take a number and make it the power of e, you will generate a number. Many calculators have an ‘.’ key where you can do this. So for example, e² = 7.389 … . What inverse operation can I perform on this number to get the ‘2’ back? This operation is called the log operation.

Now logs can use any base but again, the base e is most commonly used in math. The notation for taking the log of a number is logₑx which is often shortened to ln x. The shorthand ‘ln’ stands for ‘natural log’ as e is a natural base to use in math (topic for another post). If you have an ‘ ‘ key on your calculator, you probably also have an ‘logₑx‘ or ‘ln x‘ key as well.

So what does ‘ln x‘ mean? This operation is asking the mathematical question: “What number do I need to raise e to, so I get x?”. Can you see how this is the opposite of ‘eˣ ‘ where I actually raise e to the x power? So, ln() is asking the maths question: “What power do I need to raise e to, so that I get ?”. Isn’t it obvious that x is the number I have to raise e to, to get ? So and ln x are inverse operations. If you take the number we generated before, 7.389 … , and hit the ln x key on your calculator, you will get the original ‘2’ back.

There are many other inverse functions. In trigonometry, the sin x key in your calculator will give the sine of the angle x. Sometimes ???? is used instead of x. The inverse sine, sometimes called the arcsine, is the inverse of this. The notation you may see on your calculator for this operation is ‘ASIN x‘ or ‘SIN ̅¹x‘. SIN ̅¹x is asking the maths question: ” What angle has x as its sine?”. So SIN ̅¹[SIN(x)] is x.

There are inverse functions associated with the other trig functions as well. You will usually see inverse function keys as the same key on a calculator, you just need to hit another key first to activate the inverse definition for the key.

Easy as ????

I realise that my last few posts are a bit more advanced than my other posts. So let’s take it down a few notches. We will still be talking about angles however.

In my posts on trigonometry, I used angles measured in degrees. But that is a rather arbitrary measure. The origin of measuring angles based on 360° for a full circle is obscure, but one theory has it that it is based on ancient calendars that had 360 days in a year. In science and engineering, a different measure of angles is used, radians.

The number ???? crops up a lot, especially when talking about circles. This is because ???? is the ratio of a circle’s circumference (perimeter) to its diameter:

\[
\mathit{\pi}\hspace{0.33em}{=}\hspace{0.33em}\frac{C}{d}
\]

where C is circumference and d is diameter. This holds true no matter if the circle is as small as “o” or as large as the orbit of earth around the sun. The symbol “????” is a Greek letter with the name “pi”, and that is the symbol used to represent this ratio. In fact, it is the only way to write down this number exactly if we all agree what ???? represents. This is because ???? is an irrational number which means you cannot ever write it down exactly with numbers. Approximately, ???? is 3.14159265359… where the decimal part goes on forever without ever a repeating pattern. Irrational or not, ???? is a natural number to associate with circles.

Now if you replace the diameter d with twice the radius, that is 2r, the equation becomes

\[
\mathit{\pi}\hspace{0.33em}{=}\hspace{0.33em}\frac{C}{2r}\hspace{0.33em}\hspace{0.33em}\Longrightarrow\hspace{0.33em}\hspace{0.33em}{2}\mathit{\pi}\hspace{0.33em}{=}\hspace{0.33em}\frac{C}{r}
\]

which is again true for any size circle. Now notice that the 2???? on the left side is unitless. What do I mean by that? The right side of the equation is a circumference measured say, in meters, divided by a radius, again measured in meters. If you remember my post on units, you’ll remember that units can be cancelled in a fraction just like variables. So in this case, we have meters divided by meters which cancel each other and we are left with no units. So a full circle is associated with the unitless number 2????. What about a half circle? A half circle will have half the circumference. Half of 2???? is ????. What about a quarter circle? A quarter of 2???? is ????/2. As these numbers are all unitless, they were seen as a natural way to define angles.

So a half circle (also called a semi-circle), can be seen as an arc formed by the familiar angle 180°. The quarter circle is an arc formed by the angle 90°. But instead of degrees, we can call these angles ???? and ????/2 since these are the length of the arc formed by the angle divided by the radius. The term used to distinguish this measure of angles from degrees is radians.

This can be generalised for any angle. Please look at the below diagram:

So an angle in radians is the arclength formed by the angle divided by the radius. By the way, radians are abbreviated as rad and this is what you will probably see on your calculator when you use the radians mode.

So there are 2???? radians in a full circle, ???? radians in a semi-circle, and ????/2 for a quarter circle. We can use the fact that 180° = ???? radians to convert between the two measurements. To change degrees to radians, multiply by ????/180. To change radians to degrees, multiply by 180/????.

For example, 30° is 30 × ????/180 = ????/6 rad. It is customary to keep ???? as ???? when working with radians.

One advantage of using radians becomes immediately apparent when rearranging the equation in the figure above. The arclength formed by an angle measured in radians is simply r????.

So now that you know what radians are, my future posts will use this measure almost exclusively.

A Springy Thingy, Part 2

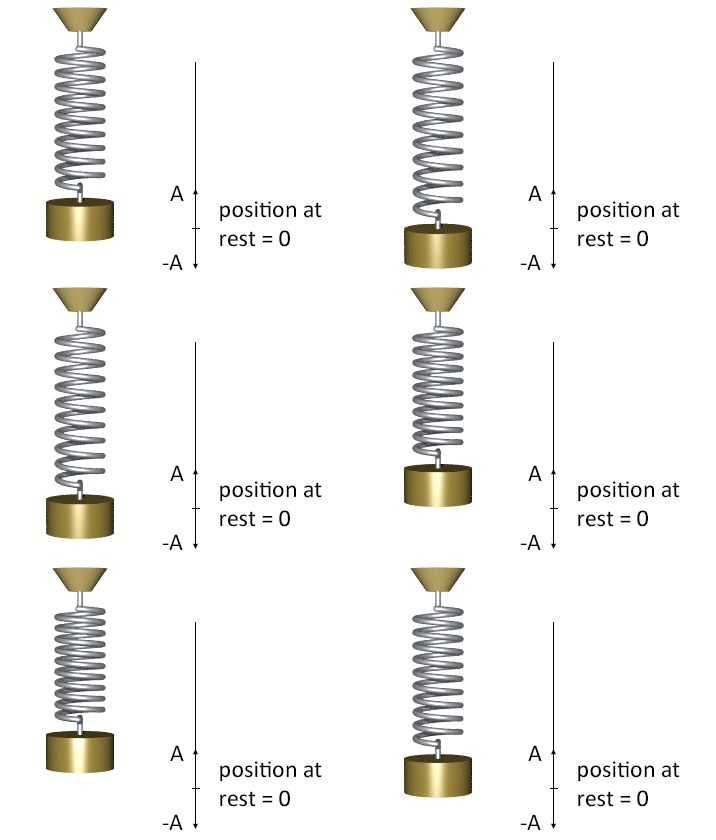
So last time, I presented the equation that describes the position of a mass on a spring:

Animated portion is licensed under the Creative Commons Attribution-Share Alike 3.0 Unported license

The equation is

\[ {x}\hspace{0.33em}{=}\hspace{0.33em}{A}\hspace{0.33em}\sin\left({\frac{180t}{\mathit{\pi}}\sqrt{\frac{k}{m}}}\right) \]

where x is the position of the mass at a given time t in seconds, k is the spring constant, and m is the mass in kg. This was developed from the equation that describes the forces on the spring (gravity and the spring), and through calculus, out pops the equation above. This equation is the sine of stuff in brackets multiplied by a number A.

Even though the stuff in the brackets looks rather ominous, we are still just taking the sine of it and the sine only goes from -1 to 1. So the maximum extent of the mass is from –A to A. Now let’s look at the stuff in the brackets.

The 180 and ???? are just there to change the rest of the expression so that you can press the sine button on your calculator in the “degrees” mode. Normally, when engineers model something like this, they use radians and not degrees. I have not explained what radians are yet so I’ve included an adjustment (the 180 and the ????) so that you can continue to use degrees. I think I’ll explain radians in my next post.

The rest of the numbers, t, k, and m are the real meat of the model. For simplicity, I have started time at 0 seconds when the mass is at its rest position and is moving upwards in the postive direction. So you would expect the position of the mass to change with time and that is what the t in the expression does. The k and the m determine how fast or how slowly the mass oscillates. Let’s actually use some numbers instead of letters here for a specific mass and spring.

Now let’s assume the spring has a spring constant of 1 kg/s² (I’ll discuss these units in my next post), and the mass connected to it is 1 kg. That means the stuff in the square root sign (called a radical) is just 1 and the square root of 1 is 1. And let’s further assume that I start the spring moving by stretching the spring 5 cm from its rest position. So now, the position equation above simplifies to

\[
{x}\hspace{0.33em}{=}\hspace{0.33em}{5}\sin\left({\frac{180t}{\mathit{\pi}}}\right)
\]

Starting at time as 0, you can choose various values of t, compute the stuff in the brackets, use the “SIN” button on your calculator which is in the “degrees” mode, and then multiply by 5. So for example, at t = 1 sec, 180/???? is 57.2958. Taking the sine of that gives 0.8415 and then multiplying that by 5 gives 4.2073 cm. So at 1 sec, the mass is 4.2073 cm above its resting position. You can plot this point and many others to graph this, or you can be lazy like me and use a graphing calculator. The graph of the position of the mass versus time for this scenario is

So no surprise, a sine wave. Now remember when I first talked about sine waves, I talked about the wavelength. Here I have indicated the wavelength as 6.28 sec. When dealing with time, the wavelength is called the period and usually represented with the symbol T. The period is the length of time it takes for one full cycle of motion. So it takes the mass 6.28 seconds to make one complete bounce. It turns out that you do not have to graph the curve to find this:

\[
{T}\hspace{0.33em}{=}\hspace{0.33em}\frac{{2}\mathit{\pi}}{\sqrt{\frac{k}{m}}}
\]

Since our k and m are each 1, T in this case is just 2????. Funny how ???? keeps cropping up. Again, I’ll explain that in my next post on radians.

Associated with the period is something called frequency. The period is how long it takes for one complete cycle to occur, whereas the frequency is how many complete cycles occur in 1 second. Frequency is the reciprocal of the period and vice versa. That is f = 1/T. So for our mass, the frequency is 1/6.28 or 0.16 cycles per second. The term “cycles per second” is given a special unit called hertz which is abbreviated as hz. You may have heard this term before.

As you change the values of k and m, the values of T and f will change as well. If the spring gets stiffer (a higher k), you would expect the frequency to increase, that is it will bounce faster. You would expect a heavier mass to slow down the frequency and it does. I will leave it as an exercise for the student to check this using a graphing calculator or Excel.

A good simulation on the web that shows the effect of changing mass an spring constant is at https://www.physicsclassroom.com/Physics-Interactives/Waves-and-Sound/Mass-on-a-Spring/Mass-on-a-Spring-Interactive. This sets up the graph a bit differently than I do here, but the frequency changes are easy to see. Also, you can add damping to this which I did not include in this post to keep it simple, but you can play with that as well on this site.

A Springy Thingy, Part 1

From my last three posts, I think we are ready to model the motion of a mass on a spring:

Animated portion is licensed under the Creative Commons Attribution-Share Alike 3.0 Unported license.

So, just like I did with the tennis ball, I will show you equations that describe this motion.

Now again, to develop these equations requires calculus, so I will just provide the final result. But before I do, just how does one begin modelling a physical process like this?

What is usually done, is to write down known equations that describe the forces acting on the mass. If you think about it, there are two: a force due to gravity and a force from the spring. There are other forces as well like resistance from the air, but as before, we will assume these to be zero to simplify the development.

Let’s first set up the picture. We have a weight on a spring. The weight has mass m. Now weight is different than mass, but on earth, the units are the same. So on earth, a 1 kg weight has a mass of 1 kg. But on the moon, the mass is still 1 kg but its weight is 0.165 kg because gravity is weaker there. We have a spring with a spring constant of k which is a measure of how stiff the spring is. The higher the value of k, the stiffer the spring.

To start the mass moving, we have stretched it A centimeters down from its resting position, then let go. We set up a one dimensional coordinate system where the rest position of the mass is 0 and up is positive.

The force due to gravity is –mg where m is the mass and g is the acceleration due to gravity. From my post on the tennis ball, remember that g is 9.8 m/s². It’s negative because the force is acting in the down direction. This comes from Isaac Newton’s second law that says that force is equal to mass times acceleration. That is, F = ma. The force due to the spring comes from something called Hooke’s Law: F = kx where k is the spring constant and x is the amount that the spring is stretched (negative) or compressed (positive) from the resting position.

So the force equation for this setup is:

F = ma = kxmg

This is the equation engineers start with before they do calculus on it. So now in this post, this is the part where a miracle happens, and I’ll give you the final result.

So the equation that shows where the mass is at a certain time is below where t is time in seconds. It is assumed that time starts (that is t = 0) when the mass is travelling upwards and is at the 0 position:

\[
%Translator MathMagic Personal Edition Mac v9.41, LaTeX converter, 2019.1.28 09:06
{x}\hspace{0.33em}{=}\hspace{0.33em}{A}\hspace{0.33em}\sin\left({\frac{180t}{\mathit{\pi}}\sqrt{\frac{k}{m}}}\right)
\]

In my next post, I’ll dissect this a bit and put some actual numbers in it and plot the results.

Graphs of Trig Equations, Part 3

I know it’s taking a while before I use maths to model a mass on a spring, but that will only make sense by fully describing the graphs of sine equations. Hopefully, this development is interesting in its own right.

Now if you were to plot the daylight length at a certain latitude against days, and if you plotted for a full year, you would see a shape that looks amazingly like the sine graph I showed you in my last post. Except at the equator, the length of a day gets longer in the summer and shorter in the winter. Without actual taking a year to collect the data, I’ve plotted the daylight length in Melbourne Australia against days using the equation

\[
{L}\hspace{0.33em}{=}\hspace{0.33em}{2}{.}{63}\sin\left({\frac{360t}{365}}\right)\hspace{0.33em}{+}\hspace{0.33em}{12}{.}{165}
\]

where L is the length of daylight in hours and t is the number of days after 22 September of any year. Why I chose 22 September is an interesting topic which I may eventually discuss, but it has to do with what are called equinoxes. The plot is below and is almost exactly the plot created if I actually measured the day length each day and plotted these for a year:

Now the shape of this curve is a sine wave but you can see several differences from the standard sine wave explored in my last post:

  1. The amplitude is 2.63 instead of 1
  2. The wavelength is 365 days instead of 360 degrees
  3. The wave is centered at 12.165 instead of the x-axis
  4. We are evaluating the sine of time instead of degrees.

Let me explain these differences.

  1. Amplitude – The value of sin(x) , regardless of what form x is in, only has values from -1 to +1. So if I multiply the sine by any number, say 2.63, so that I now have y = 2.63 sin(x), then this results in values from 2.63 × (-1) = -2.63 to 2.63 × (+1) = 2.63. This make the amplitude of this new equation 2.63, that is, the number I multiply the sine by. So in general, the amplitude of y = sin(x) is A.
  2. Wavelength – Notice that the wavelength 365 is the denominator in
\[
\sin\left({\frac{360t}{365}}\right)
\]

The 360 in the numerator is the wavelength of the standard sine wave. The common symbol to represent wavelength is the Greek letter lambda, ????, so in general, when you are taking the sine of something that looks like

\[
\sin\left({\frac{360t}{\mathit{\lambda}}}\right)
\]

the denominator, ????, is the wavelength.

Now for those of you who have had exposure to this before, you may have expected to see 2????t in the numerator instead of 360t. This would be the case if we were taking the sine of numbers expressed as radians. But this series of posts is doing everything with calculators in the degree mode. I will explain radians later in a different post.

3. Wave center – Notice that the center of the sine wave is at 12.165 which is the number added to the sine in the daylight length equation. The effect on a graph of adding a number to an equation is to raise or lower it – it does not change shape. So if you can graph and know the shape of y = something, then y = something + 10 will be the same shape, just shifted up 10 units. So adding 12.165 to the sine, doesn’t change its shape, it just changes where it is on the graph.

4. Time – The big change here is that we are no longer finding the sine of an angle. It may appear that we are now taking the sine of numbers in seconds, hours, or days – whatever the units of t are. However, the 360 in the numerator serves the purpose of making the number we are taking the sine of, unitless. That is, 360t/365 does not have any units – it is just a pure number.

Mathematicians/scientists long ago discovered that many periodic physical processes, have motions that follow a sine wave. In fact, when equations were formed that represented the forces on objects that were experiencing periodic motion, the sine of numbers involving time appeared when solving these equations.

And so it is with the length of the day throughout the year. The earth is rotating around the sun and this motion repeats, that is, is periodic. It is no surprise then that the graph of the day length is a sine wave.

I think we are now ready to model a mass on a spring. Let’s do that in my next post.

Graphs of Trig Equations, Part 2

In my last post, I showed that angles repeat every 360°. So an angle of 45° is the same as 45 + 360 = 405°. I also showed how angles can be negative if a reference line, like the positive x-axis is set up and angles created from that line going in the counter-clockwise direction are positive and going clockwise are negative. And I also showed that for angle 0°, sine 0° = 0 and sine 90° = 1. Please read my last post if needed.

Now without going through the development, it turns out that the sine has values that range from -1 to 1. Angles between 0° an 180° have positive sines and angles between 180° and 360° have negative sines. This repeats as one continues rotating around the x-axis.

Now we have already covered plotting equations so let’s plot the equation

y = sin x

where x is the angle:

So this is what a sine curve looks like. You can see that as you move along the x-axis, the curve moves up and down and repeats itself every 360°. The cosine curve is very similar but it is shifted to the left so that it begins at 1 when x = 0. So you see that the sine equation may prove useful when modelling something that repeats, like a mass on a spring bobbing up and down or a pendulum.

Now to prepare us for the modelling exercise which I will get to eventually, I want to define some characteristics of this sine curve.

First it has an amplitude. Amplitude is how high the curve goes above or below the center-line of the sine curve (or sine wave as it is frequently called). In this case, the center-line is the x-axis and the amplitude is 1 since the maximum extent of the curve is 1 unit above and below the center-line.

The sine wave has wave length. This is the distance between successive peaks (the highest points) or troughs (the lowest points). Lets look at the curve and measure the distance between any successive peaks. There is a peak at x = 90 and the next one is at x = 450. The distance between these two points on the x-axis is 450 – 90 = 360. This is what we expected as we know the sine curve repeats every 360° which is what wavelength means.

Associated with wavelength is something call frequency, but this will not make sense until I do a bit more development and include time in the mix. Stay tuned for the next post!

Graphs of Trig Equations, Part 1

Happy New Year and welcome to my first post of 2019!

My last post introduced the idea of modelling physical things with math equations. To do this from scratch, requires calculus but seeing the final result is very interesting. So in my last post, I modelled the simple physical event of a ball thrown into the air. Another common example when introducing modelling to students is a mass on a spring. But before I develop this, I want to show what the graphs of some trigonometric equations look like as they will be needed to describe any kind of motion that is cyclic, that is, repeats like a mass on a spring bobbing up and down.

So in a previous post, I defined what sin ???? and cos ???? are in terms of a right triangle. Given the below triangle

the sine and cosine of ???? are defined as\[ \sin\mathit{\theta}\hspace{0.33em}{=}\hspace{0.33em}\frac{\mathrm{opp}}{\mathrm{hyp}}\hspace{0.33em}\hspace{0.33em}\hspace{0.33em}\hspace{0.33em}\hspace{0.33em}\hspace{0.33em}\hspace{0.33em}\cos\mathit{\theta}\hspace{0.33em}{=}\hspace{0.33em}\frac{\mathrm{adj}}{\mathrm{hyp}}\]

Let’s look at the sine for now. For very small angles, the opposite side will be small compared to the hypotenuse. Graphically, I think you can see that for an angle of 0°, there would be no opposite side so sin 0° = 0.

In the other extreme, as the angle gets close to 90°, the opposite side is close to the length of the hypotenuse, so the sine approaches 1. In fact,

sin 90° = 1.

Now angles are periodic in that they repeat every 360°. That is, an angle of 30° is also 30 + 360 = 390°. Another full circle of 360° can be added again to get an equivalent angle 390 + 360 = 750°. Angles can also be negative based on a convention of which direction you move to create the angle. Even with negative angles, multiple of 360° can be added or subtracted to get an equivalent angle whose sine will be the same. The below diagram shows these variations based on angles generated from the positive x-axis:

The angle in red is a positive angle, that is it is formed by going in the counter-clockwise direction from the x-axis. From that angle, you can go 1, 2, 3, etc complete circles to form the same angle. The angle in blue is a negative angle, that is it is formed by going clockwise from the x-axis. One can also go multiple complete circles around this angle to get the same angle. The point is that as you measure angles from 0, either in the positive or negative direction. you eventually repeat the same angles and these same angles will have the same sine value.

In my next post, I will plot the sine values against the angle values and show graphically what “periodic” means.

The Attitude of Latitude

There are many applications of trigonometry in everyday life. One of these is the position of anything on the earth. You have undoubtedly heard of latitude and longitude. These are coordinates defined on the earth’s surface that provide the position of a point, much like defining the position of a point on a cartesian coordinate system ( see my posts on Graphing). As of this writing, my position is -37.6836353 latitude and 144.746533 longitude. A more traditional way to express this location is 37° 41′ 1.086” S, 144° 44′ 47.5182” E. Notice that in the second way, the degree symbol is used. This is because latitude and longitude are angles. I’ll explain that in a minute.

Also notice that in the second method, that there are the symbols ‘ and ”. These mean “minutes” and “seconds” respectively. Just like hours, a degree is split into 60 minutes, and each minute is is divided into 60 seconds. So one difference between the using two methods is whether you want to use minutes and seconds for parts of a degree or decimals. This is the same as saying the time is now 9 hours, 4 minutes, 40 seconds or 9.0778 hours

Another difference between the two methods is that the first uses negative and implied positive signs while the second uses S and N for latitude and E and W for longitude. For latitude, S means South and N means North. For longitude, E means East and W means West. 

So how are these angles measured? The below graphic helps explain these angles:

Let’s first look at longitude. This angle is frequently represented with the greek letter phi, ϕ. Imagine circles around the earth that pass through both poles. These are called great circles as they are the largest circles that can be drawn on the earth’s surface and divide the earth into two hemispheres (assuming that the earth is a perfect sphere). One of these circles was designated as a reference circle called the prime meridian. This reference circle was finally (after a history of development) agreed upon in 1884. It is designated as the 0° circle of longitude on the side that passes through Greenwich, England. Other great circles, like the one in red above, are an angle away from the prime meridian. One can go east (positive) from this reference circle or west (negative) until you get to the other side of the prime meridian. So the largest longitude angles are ±180°. Let’s now look at latitude.

The latitude angle is often represented with the greek letter lambda, ????. The reference for this angle is a much more natural geometric one, the equator. The equator is 0° latitude. Along any great longitude circle, like the one in red above, one can go north (positive) or south (negative) to form an angle with the equator, measured at the earths centre like longitude. So the largest latitude angles are ±90° which are the poles.

Now before GPS and other navigational aids, it was a real trick to know your position on earth. Longitude was particularly tricky, but measuring latitude was very possible. How that was done, will be the topic of my next post.